
6 Market Conditions the System Must Survive
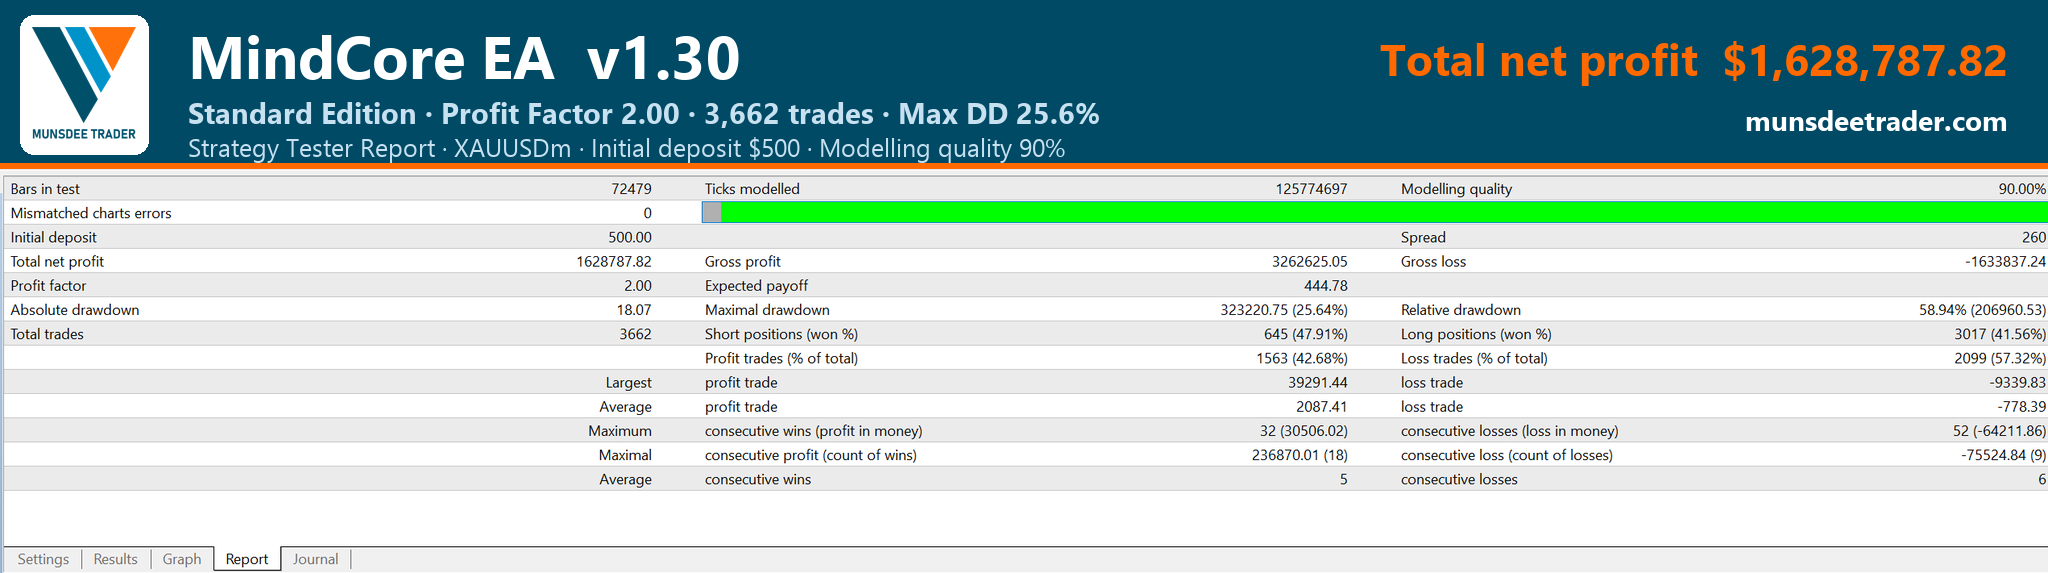
Every number on this page is cut from one single test run, not from separate runs — the complete system (MindCore Engine + EA) on MetaTrader Strategy Tester, every tick mode, M1 data, $500 starting capital, 260-point spread, 0.75% standard risk per trade, February 2017 to September 2026: 3,662 trades, profit factor 2.00, maximum drawdown 25.69%.
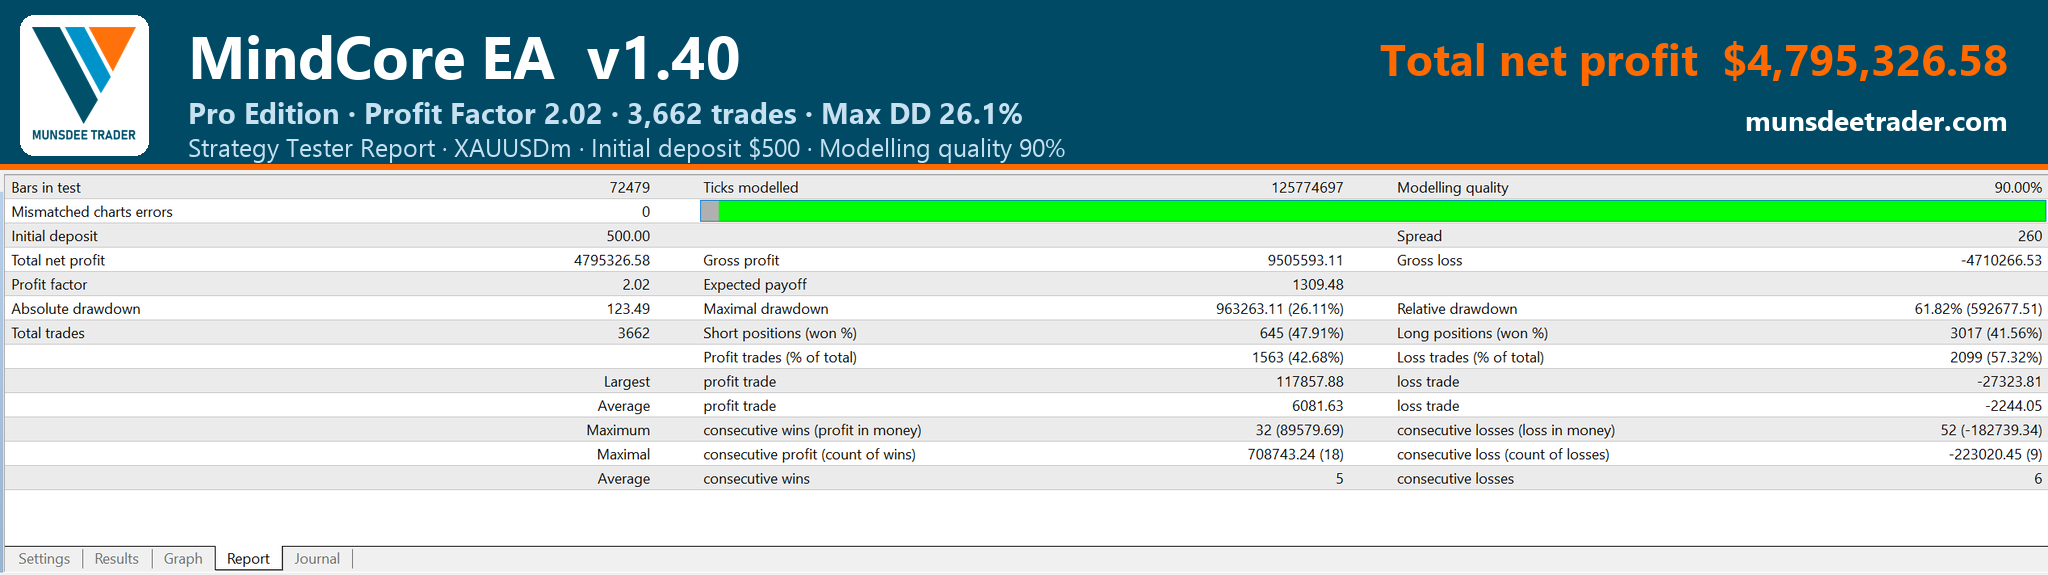
Every figure on this page is for the Standard 1.30 edition (1.00 lot ceiling). Pro 1.40, with a 3.00 lot ceiling, returned $4,795,327 on the same test, profit factor 2.02, maximum drawdown 26.11%.
Why returns are shown as percentages:position size is calculated from current equity, so as the account grows the positions grow with it. Dollar figures from different windows are not comparable, so each window shows its return as a percentage of the account on the day that window started.
Why 2008, 2011 and 2013 are not here:MindCore Engine needs minute data across all seven timeframes, which we hold from 2016 onward. We are building that data back to 2003 now. Whatever the result turns out to be, it goes on this page.

Full Strategy Tester Reports
Reports exactly as MetaTrader 4 Strategy Tester produced them, numbers untouched — both editions on the same data set, February 2017 to September 2026, $500 starting capital, 260-point spread
Click an image to view full size
MetaTrader 5
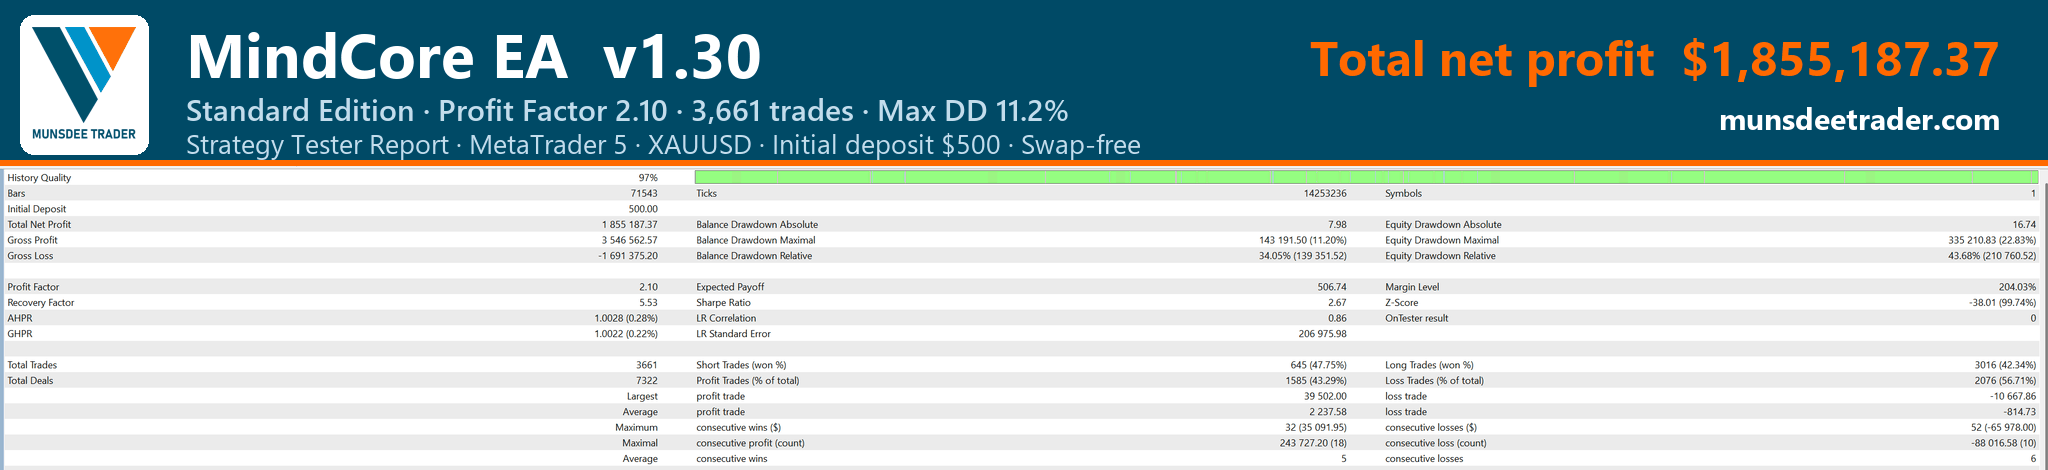
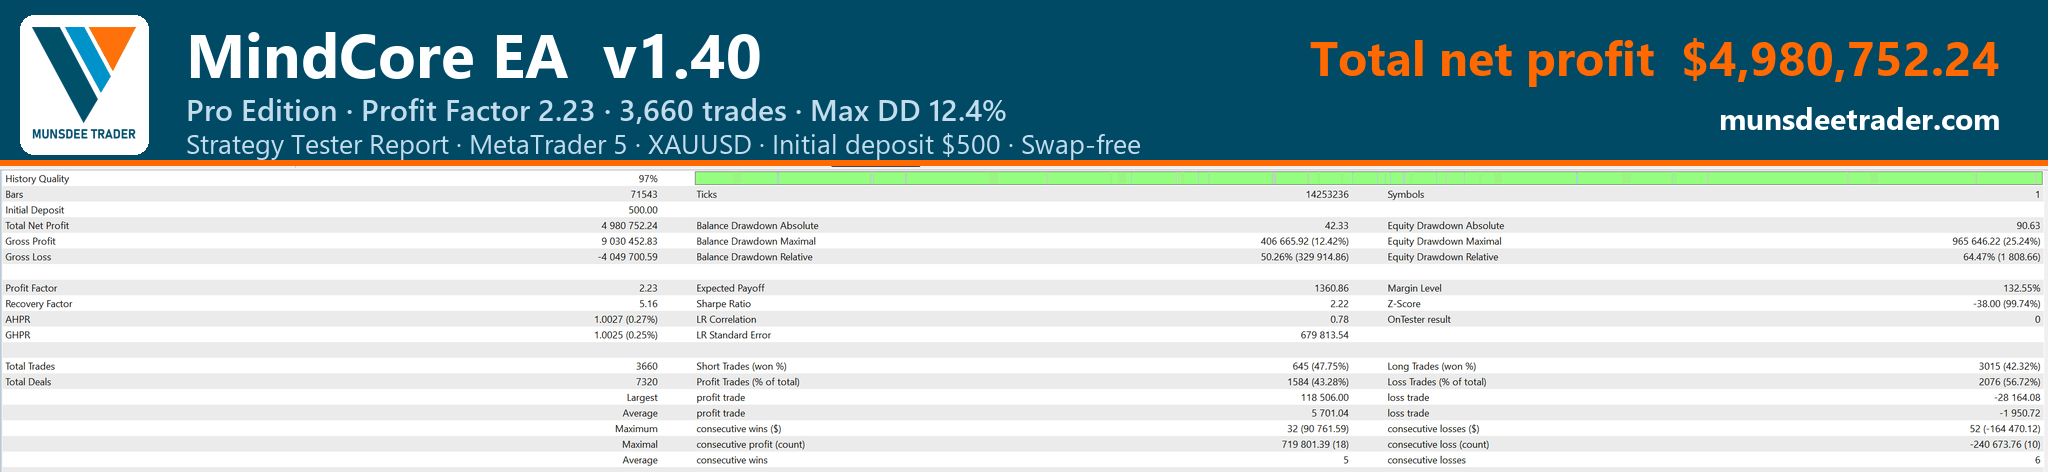
Reports exactly as MetaTrader 5 Strategy Tester produced them, numbers untouched — both editions on the same data set, February 2017 to September 2026, $500 starting capital · tested as a swap-free account · 1 minute OHLC modelling
Backtest results are not a guarantee of future performance. Trading involves risk; use only capital you can afford to lose.
| Run | Period | Scenario | Trades | Win % | Profit factor | Return | DD in window |
|---|---|---|---|---|---|---|---|
| 1 | 2024.12.20 to 2026.09.05 | Current uptrend | 1,031 | 50 | 2.56 | +457.5% | 18.4% |
| 2 | 2020.02.10 to 2020.04.30 | COVID-19 crash | 107 | 43 | 2.13 | +86.5% | 14.1% |
| 3 | 2026.01.01 to 2026.02.28 | Peak 5,597 then 16% drop | 140 | 74 | 9.50 | +61.1% | 1.6% |
| 4 | 2022.03.01 to 2022.11.30 | Slow bear market, Fed hiking | 270 | 43 | 1.48 | +47.5% | 20.1% |
| 5 | 2023.01.01 to 2023.12.31 | Full year of high rates | 342 | 40 | 1.34 | +33.8% | 18.1% |
| 6 | 2022.02.14 to 2022.02.28 | Russia invades Ukraine | 49 | 24 | 1.18 | +3.3% | 11.4% |
All six windows were profitable. The aggregate figures for the whole test are above: 43% of trades closed in profit, maximum drawdown 25.69%. Every system has losing trades, and ours are all measured.
Interpreting Each Run's Results
January 2026: gold fell $397 in one hour. How did the system survive?+61.1%
On 29 January 2026 gold dropped 397 dollars within a single hour. Across those two months the system took 140 trades, won 74% of them, reached a profit factor of 9.50, and its worst drawdown along the way was 1.6%. The stop loss sits on the broker's server from the second a trade opens, rather than being a condition in code that disappears when a machine dies.
Can I replicate this myself? Yes
Yes. Members download the command file MindCore_commands.enc from the download page and run Strategy Tester themselves.
How — put the file in MQL4\Files (Common\Files on MT5), enter your key in InpLicenseKey, enter the file name in InpCmdReplayFile, and press Start.
The file is encrypted to your key alone — open it in a text editor and you see nothing but noise. Only the EA can read it, and every member receives a different file.
Before you run — the numbers match this page when you use the same M1 data (Exness XAUUSDm, 260-point spread, every-tick mode). You prepare the historical M1 data yourself from your own broker; different data gives slightly different results through spread and server time. A shorter test window returns the result for that window, not the totals shown here.
